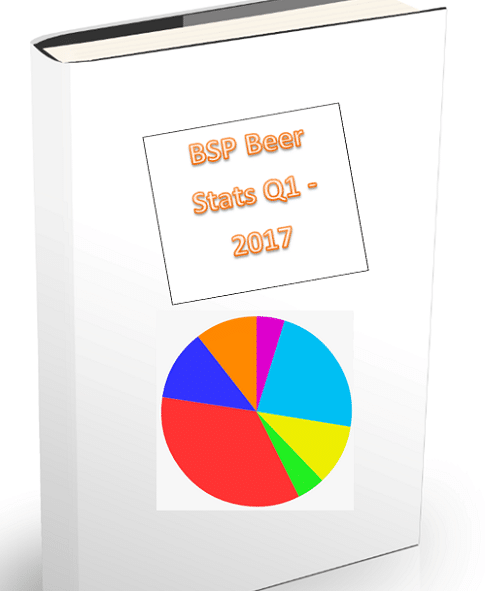
With one 1/4 of the year in the history books, and with the US still standing despite our current not-my-president, it is time for a quick look at the numbers of my beer drinking.
This little Excel spreadsheet was initially done to track spending primarily and then sheer tonnage of drinking. It has diversified a bit with the addition of ABV and a limited style selector.
When we ended 2016 I was spending $60.95 a week and drinking 204.31 ounces with an average ABV of 6.74%.
To compare and contrast, so far in 2017 that spending number is down significantly to $42.25 a week. Partially chalked up to beers bought for me for my birthday and an increase in media samples. But also due in part to the fact that the amount number is down 14oz to 190 even. The ABV saw the least dramatic shift down to 6.58%. But the ABV has been the slowest to change and in a much tighter band.
I have been quite aware of the amount each week, more so than last year and have made progress in decreasing the ounces drunk each night. This is part of the reasoning behind tracking the beer is to make myself cognizant of what I am doing and then make alterations.
Speaking of altering…
The style descriptor is a quick and dirty measurement. For each beer, I tag it with a Y or N. Y for the “Big 3” styles. IPA, Sour and Barrel-Aged. And those three show up 152 times as opposed to 77 for everything else.
Which tells me that I need to diversify for Q2.