The 2018 Statistical Beer Review

Let’s get straight to the main data points that I track. Column A being Ounces Drunk – The goal was 175 per week and I finished with 167.81. 7.19 clear! That year average was 21.86 lower than its 2017 counterpart and 36.50 from 2016.

It is probably the last large double drop though as I get closer to the two pints over 5 drinking days in a week (160 magic number). Speaking of, I have now completed 2 full years of having 2 non-drinking days each week. Not to throw shade at the Dry-uary crowd because health is important no matter how you do it, I have 3 months off from beer in 2017 and 2018 just not consecutively.

ABV is an important control column but it didn’t budge from the 6.6 to 6.7% range. With a low of 5.73% and a high of 8.90%. The average dollars spent per week is still too high at $42.87. That may be the number that needs the most attention in 2019.

Now onto the beers and breweries: zooming in from the macro view. I had 350 beers that did not fall into the “Big 3” of IPA, Sour and Barrel-Aged and 438 that fell into that grouping with most being IPA. 788 beers that I had at least 4oz of.

I was a bit surprised to see that Sierra Nevada claimed the top spot in number of beers drunk but then took a look to see Celebration Christmas, Bigfoot and Resilience leading the way. What was weirder still in this shrinking regional world was that New Belgium was # 3 (an only non California Brewery in the top 10), Stone # 5 and Firestone Walker at # 9. My usual suspects are in that 10 as well with Eagle Rock, Smog City, Highland Park and El Segundo, joined by newcomer L.A. Ale Works.

On the other side was 94 beers that were my only taste of a brewery and 6 of those were as half of a collaboration beer.

I am pondering if I should break out IPA as a separate counted category or 16oz cans to be even more specific in 2019. Because there are always more ways to parse the data.
Statistics Update


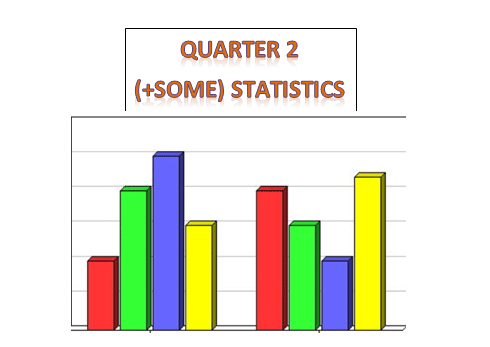
Missed my quarterly statistical check-in by a few weeks but here is the latest data….

… over the last four months, I have drunk 55.51% of the big three styles (IPA, Barreled and Sour) to 44.49% of everything else. I would still like that to be a more equitable split and it was probably higher than normal due to the Sierra Nevada Beer Camp Across the World variety box.

That box shows up in the Brewery rankings, launching Sierra Nevada to a tie for the top spot with Eagle Rock at 13 which is due to the Session Fest and the tasters there. I am also happy to report that locals from El Segundo (12), Highland Park (11), Mumford Brewing (10) broke the double digit mark and that of the top 20, and that 12 of the top 20 are part of the L.A. guild.

Looking at the current running averages, I am at 193.6 ounces per 7 day week. That is mid-range of a tight spectrum that has a low of 191 and a high of 195. The ABV range is even tighter which is the lowest it has been though that isn’t such a distinction when the highest is 6.94%. ABV has been the most stuck in a rut category though.

The next goal is to bring down that ounces total to around 190. Now that I am passed the big beer weeks of Firestone Walker and L.A. Beer Week, I just might be able to hit that mark.

1st Quarter Stats


With one 1/4 of the year in the history books, and with the US still standing despite our current not-my-president, it is time for a quick look at the numbers of my beer drinking.

This little Excel spreadsheet was initially done to track spending primarily and then sheer tonnage of drinking. It has diversified a bit with the addition of ABV and a limited style selector.

When we ended 2016 I was spending $60.95 a week and drinking 204.31 ounces with an average ABV of 6.74%.

To compare and contrast, so far in 2017 that spending number is down significantly to $42.25 a week. Partially chalked up to beers bought for me for my birthday and an increase in media samples. But also due in part to the fact that the amount number is down 14oz to 190 even. The ABV saw the least dramatic shift down to 6.58%. But the ABV has been the slowest to change and in a much tighter band.

I have been quite aware of the amount each week, more so than last year and have made progress in decreasing the ounces drunk each night. This is part of the reasoning behind tracking the beer is to make myself cognizant of what I am doing and then make alterations.

Speaking of altering…

The style descriptor is a quick and dirty measurement. For each beer, I tag it with a Y or N. Y for the “Big 3” styles. IPA, Sour and Barrel-Aged. And those three show up 152 times as opposed to 77 for everything else.

Which tells me that I need to diversify for Q2.